How to enter data science 1. The target
#careers
#data-science
Written by Matt Sosna on August 27, 2020
The data science hype is real. Glassdoor labeled data scientist as the best job in America four years in a row, nudged out of the top spot only this year. Data science is transforming medicine, healthcare, finance, business, nonprofits, and government. MIT is spending a billion dollars on a college dedicated solely to AI. An entire education industry has sprouted to train new data scientists as fast as possible to fill the burgeoning demand, and for good reason: when 90 percent of the world’s data was generated in the last two years, we’re in dire need of people who understand how to find patterns in that pile of numbers.
When there’s a good match between employer and employee, data science is a rewarding profession. Yet at the same time, a 2017 Financial Times report found that 13% of data scientists were looking to change jobs, largely driven by disillusionment with the actual work. A 2019 Women in Data UK survey also indicated the majority were planning to change jobs the next year.
Wait, so what’s the take-away? Is data science a dream job or should I stay away? My take-away, which I share even with disillusioned data scientists, is that data science is indeed an awesome profession - come join us! But at the same time, choose your employer carefully.
This post assumes you’re interested in making the switch to data science. Welcome! In this post, I’ll help you make an informed choice on the exact type of data science role you’d be happiest in. In parts two through five of this series, I’ll outline the technical and non-technical skills needed for you to succeed.
How to enter data science:
- The target
- The statistics
- The analytics
- The engineering
- The people
Table of contents
What is a data scientist?
We first need to define what we mean by data scientist. Looking at job descriptions surprisingly leaves us more confused: thanks to the explosion in interest in data science over the past decade, companies are happy to assign the “data scientist” label in job postings that could also be titled statistician, data analyst, data engineer, machine learning engineer, or even software engineer. Indeed, you can actually apply machine learning to the posts to identify several clusters of more specific jobs within “data scientist”!
Let’s try to make some sense of the variation. At its core, data science revolves around two ideas:
- Deriving insights from data
- Communicating those insights to others
These two points sound straightforward, but there is tremendous variability in what they mean in the real world. The methods used for deriving insights vary from techniques we’ve had for over 100 years to methods at the limits of present-day computational capacity. Similarly, communicating insights looks a lot different if the consumer of those insights is a CEO or an algorithm. The internet abounds with great thought pieces carefully outlining data scientists’ exact responsibilities[1], so in this post I’ll instead frame things in terms of spectrums of responsibilities.
The scalpel versus the shovel
Let’s start with something I call the “analytics-engineering” spectrum. Note that I’ve purposely omitted several related occupations[2] to narrow in on what most differentiates data science from analytics and engineering.
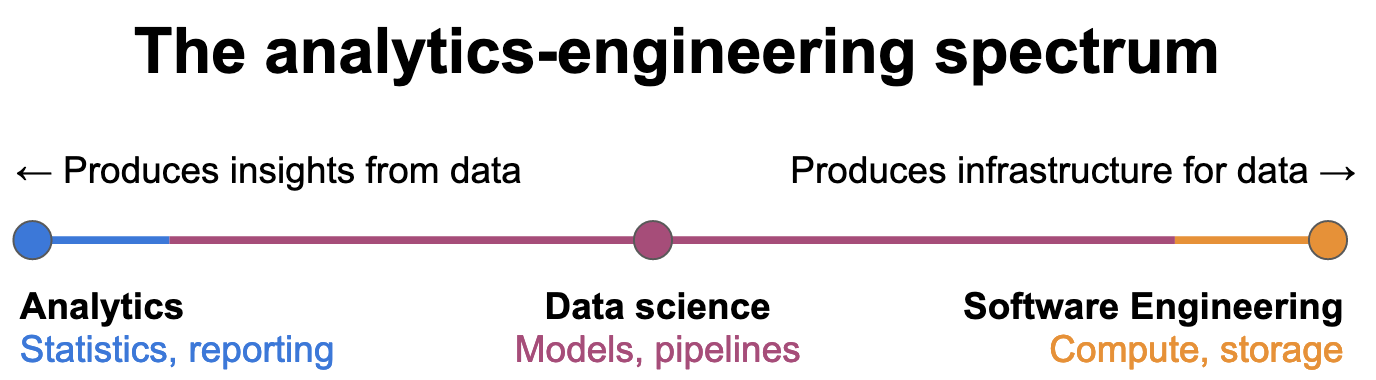
I think of this spectrum as “the scalpel versus the shovel.” An analyst examines data to find insights (scalpel), while the engineer builds infrastructure to store and move data (shovel). An analyst needs access to data; an engineer can build databases and APIs to enable this. An engineer needs clear direction on what to build; an analyst’s findings can identify the highest-value initiatives to pursue. An analytics team delivers the most value when their insights are accurate and acted upon by the organization. An engineering team is most valuable when there is a range of technical talent that works well together.
Somewhere between these vastly different roles lies the data scientist. A data scientist is often expected to both understand the data and build the infrastructure to distribute insights to the rest of the organization. They may build a statistical model that accurately describes some data, for example, and then build a pipeline to populate a customer-facing dashboard with daily predictions from that model. Their product isn’t just the knowledge or just the pipeline - it’s some combination of both.
Expectations vary widely on where on this spectrum - as well as how much of the spectrum! - a data scientist is expected to cover. A mature big-tech company likely has data scientists in specialized roles, for example working solely on writing more efficient deep learning algorithms. A younger company, meanwhile, will expect the data scientist to span most of the spectrum, and maybe even dabble in software engineering.
How many cores?
Another spectrum we need to briefly mention is the amount and complexity of data being processed, which determines the methods needed to derive insights. Any analysis in the heatmap below can fall under the umbrella of “data science,” though the sophistication of coding ability needed varies from relatively little, to years of experience with memory management and distributed computing. Below, warmer colors indicate greater computational complexity.
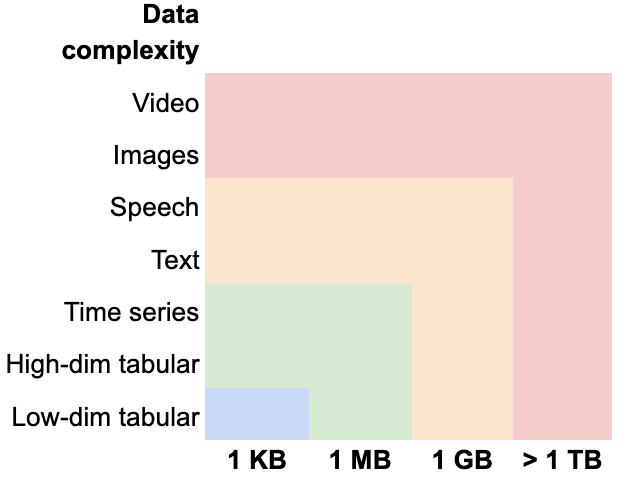
As you increase the size of the dataset (x-axis), matrix operations like inverses and transposes in frequentist statistics become computationally heavy compared to the iterative methods of machine learning. Large datasets are also where we need to start thinking about dividing our task among parallel computer cores, renting powerful servers in the cloud, and utilizing parts of the computer normally reserved for rendering graphics. (Hopefully there are data engineers around to help!)
Similarly, as you increase the complexity of the data (y-axis), you quickly increase the number of iterations an algorithm needs, or the number of calculations per iteration. This is where techniques like deep learning or reinforcement learning become necessary: to identify an animal in an image, a neural network has layers upon layers of functions that scroll through pixels to find lines, then layers for building on that input to identify circles, then mouths, eyes, and faces, until many calculations later it predicts “cat” based off the best match with example images it was trained on. Phew! One image down, onto the next!
The red zone may seem appealing because bigger and more complex is always better, right? Well, there are definite drawbacks: for very large datasets, it’s easy to find spurious correlations, and ignoring fundamental stats principles still makes you reach incorrect conclusions. Rather than mountains of data, it’s much more valuable to have high-precision data. Meanwhile, for sophisticated methods like deep learning, explaining how the model came to its conclusion is surprisingly difficult and can lead to lack of faith in the conclusions.
Ultimately, though, you’re likely to only use any of these red-zone methods in companies with boatloads of data. If there’s no need for something complex, you’ll likely find yourself forgoing the deep learning packages and instead cranking out linear and logistic regressions. (Which if done correctly, are incredibly valuable and shouldn’t be frowned upon. Answering the question correctly is better than using a cool technique just because it’s cool.)
Taking it to the real world
The job market
The point of the last two sections is to show the vast range in:
- Expectations on what level of analytics and engineering a data scientist will bring to the table
- The complexity and size of datasets that can be addressed with data science methods
Let’s now use these spectrums to start making some sense of the variation in job posts titled “data scientist.” We’ll start with a sample job post from Yelp. The title is data scientist, and the position lies deep in the analytics side of the spectrum.
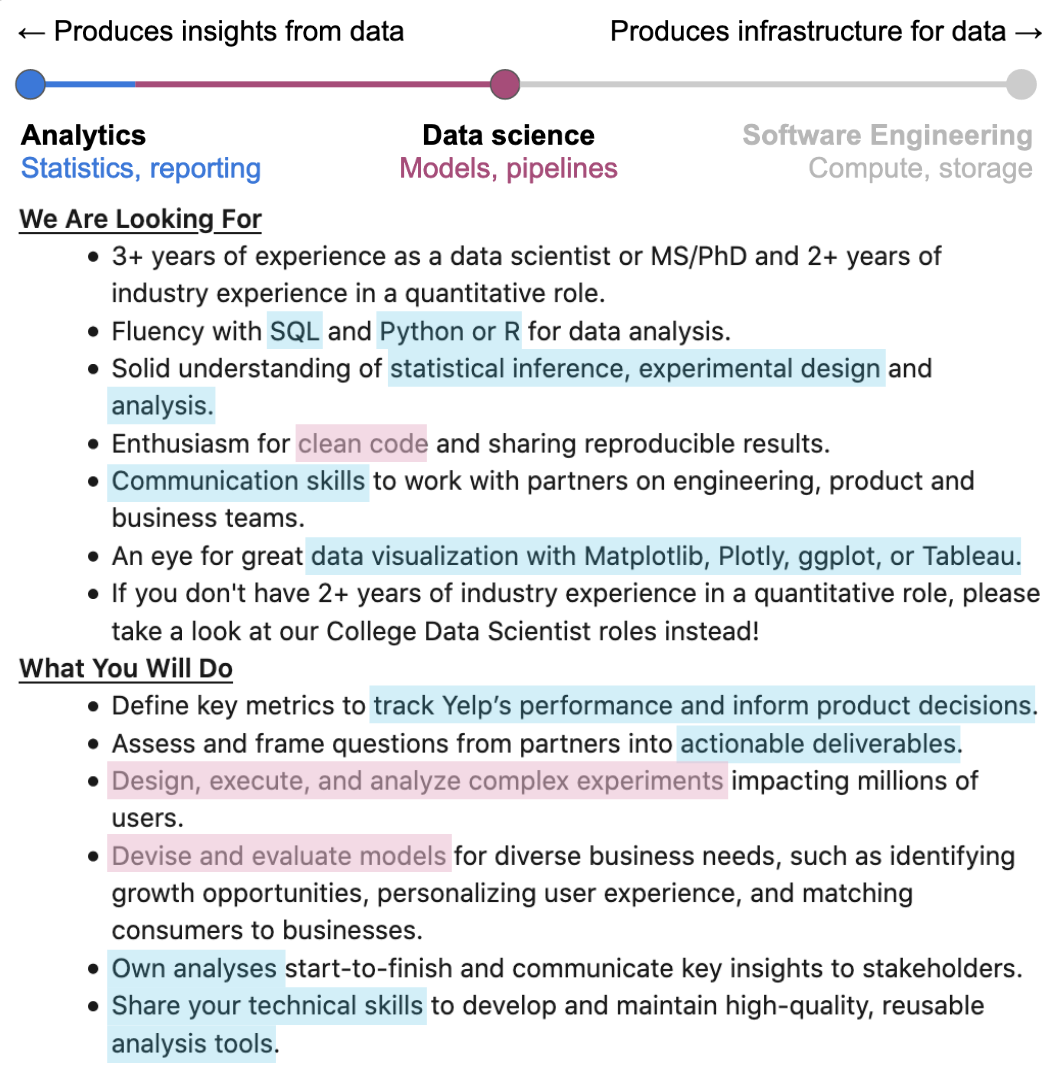
It’s hard to tell where on the computational complexity heatmap this job falls without seeing specific data science techniques listed, but we can make some inferences. Yelp’s data consists of tens of millions of numerical rankings and text reviews, meaning their data scientists are likely employing machine learning and natural language processing. Yet, because the job post mentions running experiments that impact millions of users, the data science involved may be more focused on how users interact with the site and app itself. These analyses will likely involve A/B testing, which is typically light on the computational complexity but requires careful statistical control of noise not relevant to the business questions. It’s also clear that Yelp expects the person in this role to provide guidance for business decisions, meaning statistical nuance is important.
Now let’s look at the other end of the spectrum. Here’s a sample job posting from Tesla. Again the title is data scientist, but this time the position is heavy on the engineering.
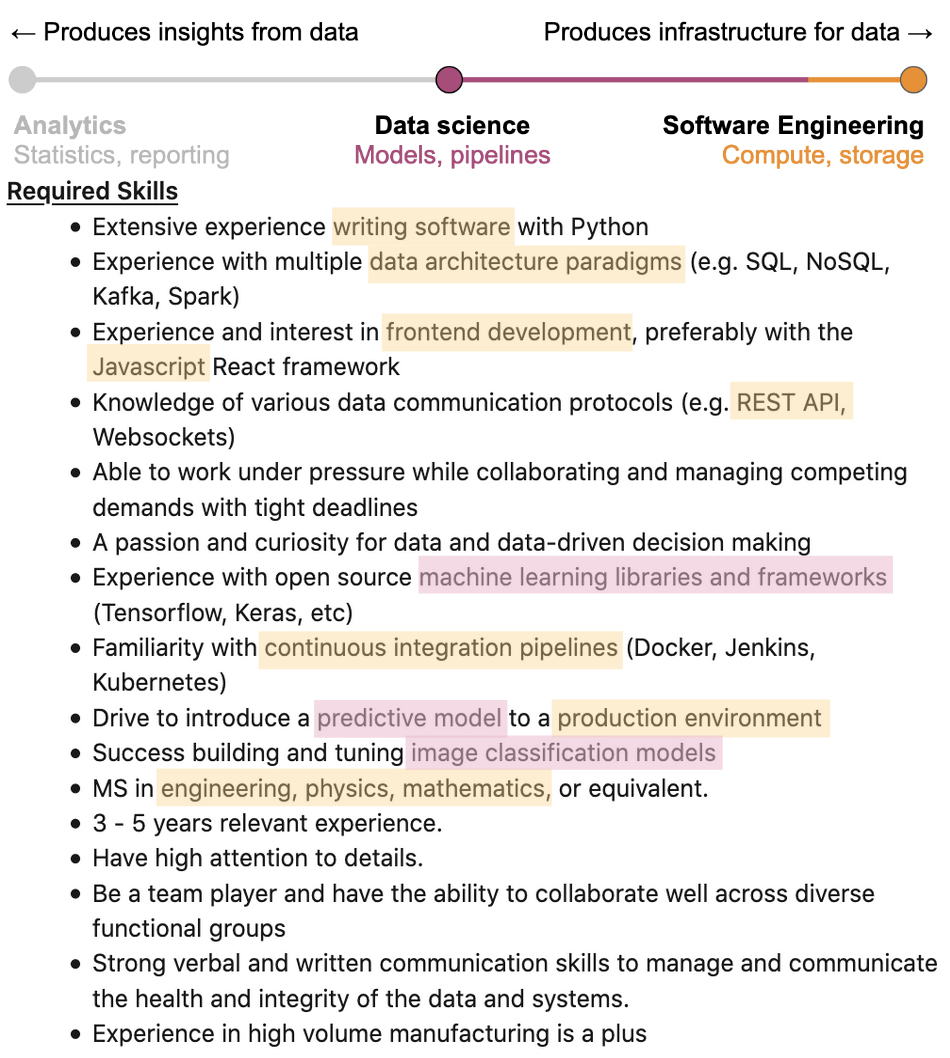
It’s clear that this job falls in the red zone of computational complexity. Tensorflow and Keras are tools for deep learning; you’ll likely be working on improving how Tesla’s autonomous driving algorithms process images dozens or even hundreds of times per second. Continuous integration, REST APIs, and JavaScript are clear signs that the person for this role is expected to have software engineering chops. The big-picture questions Tesla is trying to solve with data science are likely well-defined - now it’s time to flex some muscle with state-of-the-art computation.
So what about you?
As we can see, “data scientist” is a catch-all phrase for a wide range of work, much like how the term “engineer” encompasses dozens of professions. To figure out where on the data science spectrum you’d like to be, I’d ask yourself a few questions:
- How much do I care about statistical nuances like random effects and representative sampling?
- Not at all, give me the determinism of code –> + engineering
- I care a lot, and p.s. p-values are misleading! –> + analytics
- How much do I care about optimizing code to make it more efficient?
- This function is 150 lines long - let’s modularize that –> + engineering
- Getting the stats right is more important than writing perfect code –> + analytics
- How much do I want to build a pipeline once the analysis is complete?
- Actually, I care more about the pipeline than the analysis –> + engineering
- I’d rather focus on making sure any conclusion I produce is accurate –> + analytics
I lean towards analytics!
If you found yourself identifying more with the analytics answers, I’d focus on building strong skills in R and data visualization, good SQL, and decent Excel. A major bonus would be dashboarding skills like Shiny, Tableau, or D3.js. A crucial part of your job will be communicating insights to stakeholders, so you’ll need expert-level skills in explaining your analyses and their conclusions. Your best bet for employers will be mature companies with established data pipelines and who have identified the need for dedicated analysts helping inform business decisions. As a next step, I’d highly recommend Cassie Kozyrkov’s Harvard Business Review article “What Great Data Analysts Do - And Why Every Organization Needs Them.”
I lean towards engineering!
If you found yourself identifying more with the engineering answers, I’d focus on building strong skills in Python, SQL, and cloud computing. Understanding data architecture best practices, such as relational versus non-relational databases or how to configure a Spark cluster, becomes important. JavaScript veers away from data science but is crucial for integrating your work seamlessly into the rest of a company’s product. If you want to work on huge datasets, consider adding in Scala or Java. Your code will be your product, so you’ll want to read up on coding best practices and maybe even a textbook or two. Being able to write efficient code in an array of languages will let you tackle a wide range of challenges - ideal for data and software engineering.
I want it all!
If you don’t fall neatly in the pure analytics vs. pure engineering bucket, that’s great! There are plenty of jobs out there with the right level of computational complexity and analytics vs. engineering you’re looking for. No matter where on the spectrum you fall, though, I’d focus on leveling up your Python and SQL, as well as being able to identify relevant questions for an organization. The data scientist that has the business sense to identify the right question to pursue, the analytical strength to find answers to those analyses, and the self-sufficiency to deploy the results of those analyses is considered a tremendously valuable unicorn. I’ll go into more detail on the technical and non-technical skills in an upcoming post.
What now?
No matter what path you want to take, start building a portfolio. A GitHub repo is fine, or a blog like this one. Projects are key to learning - when you’re forced to demonstrate an analysis or build an API yourself, you internalize concepts that can otherwise stay abstract. When applying to jobs, it’s also helpful to have some proof of your coding ability beyond a line on your CV. Writing my Intro to R series was critical for me developing as a programmer, and it helped land me my first job out of grad school. The team was coding solely in Python, which I didn’t have much experience in, but my boss (secretly) read my R blog posts and figured I understood programming well enough to pick up Python on the fly. It worked!
Once you know where on the analytics-engineering spectrum and computational complexity spectrums you fall, start filtering out job posts that don’t involve the sort of work you’d want to do. No use spending energy on a job you don’t want to do anyway! Similarly, start thinking about the field you want to contribute to. Especially in analytics and data science, your work will require solid understanding of the field’s challenges and your organization’s strategy to address them. Your job will be much more enjoyable if you find the field interesting! Finally, once you’re interviewing for jobs, look out for data science red flags, such as a lack of engineering support for data scientists, no version control, or fuzzy answers about the amount of analytics versus engineering the role involves.
Good luck! Grad students and postdocs looking to enter data science, keep an eye out for an upcoming post aimed at you. And as always, feel free to reach out to me if I can help you.
Best,
Matt
Footnotes
1. What is a data scientist?
Here are a few pieces that I think are particularly insightful.
- Andrew Zola, Springboard: “Machine Learning Engineer vs. Data Scientist”
- Yael Gerten, Harvard Business Review: “The Kinds of Data Scientist”
- Cassie Kozyrkov, Hackernoon: “Why businesses fail at machine learning”
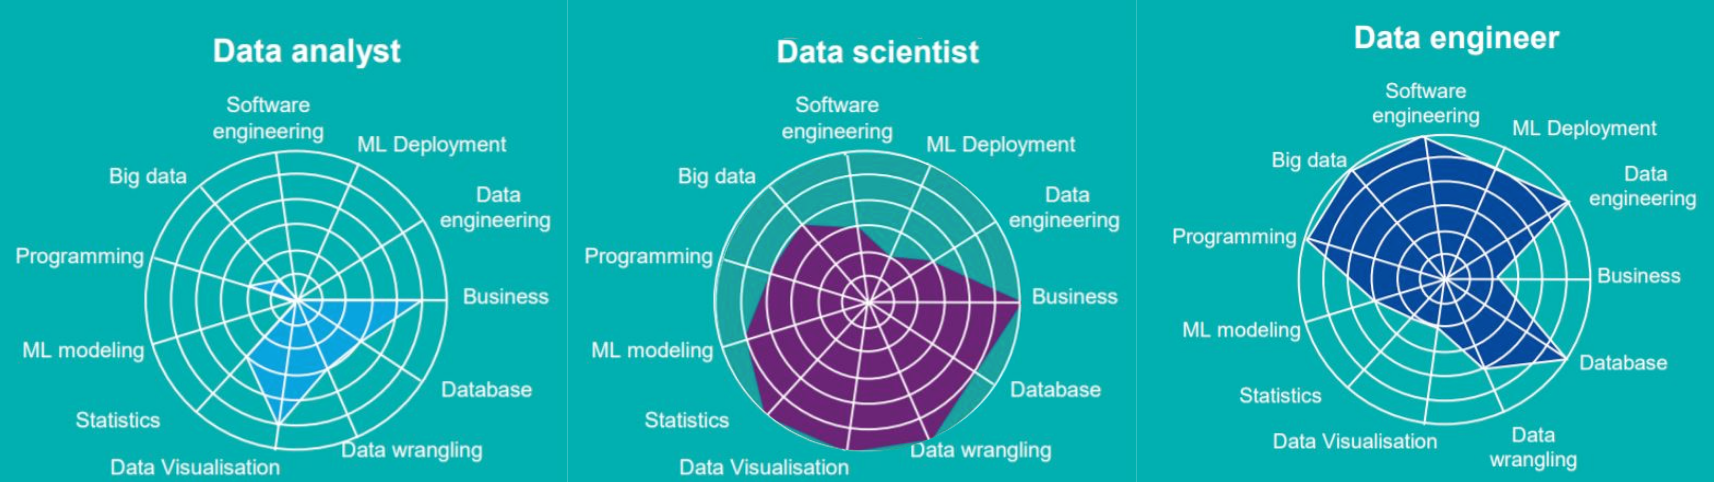
2. The scalpel versus the shovel
Machine learning engineers, computational social scientists, statisticians, deep learning researchers, business intelligence analysts… there’s a lot more we could add here, but our spectrum would start becoming two- or three-dimensional. For an alternate take, here are some interesting visuals I spliced together from a piece by efinancialcareers: